 Root Sum Squares (RSS) approach to Tolerance Analysis has solid a foundation in capturing the effects of variation. In the days of the golden abacus, there were no super-fast processors willing to calculate the multiple output possibilities in a matter of seconds (as can be done with Monte Carlo simulators on our laptops). It has its merits and faults but is generally a good approach to predicting output variation when the responses are fairly linear and input variation approaches normality. That is the case for plenty of Tolerance Analysis dimensional responses so we will utilize this method on our non-linear case of the one-way clutch.
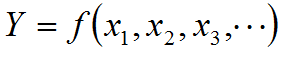
The outputs of the RSS calculations are for a predicted mean and predicted standard deviation. It requires a mathematical expression such that
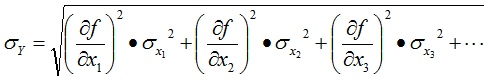
Using Taylor Series-based approximations of the underlying response equation, it can be shown that the response variance is equal to the sum product of individual variances (σxi2) and their sensitivities (1st derivatives) squared:
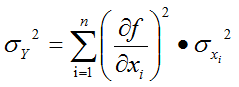
Taking the square root yields the first of the RSS equations, which predicts output variation in the form of a standard deviation:
The other RSS equation predicts the mean value of the response. Intuitively, one would expect that by plugging in the means of the input variations to the transfer function yields the output mean. Close but with the exception of an additional term dependent on 2nd derivatives as follows:
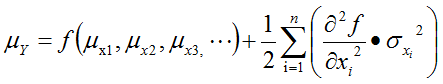
(An important side note: The RSS derivations are made with many simplifying assumptions where higher-order terms are discarded, as done with most Taylor Series work. It can get you in trouble if the transfer function displays non-linearities or curvature but is generally well respected.)
In order to calculate them, the engineer needs to assume values for the inputs (both means and standard deviations) and to perform differential calculus on the underlying response equations. Not a task for the un-initiated. For this reason alone, many engineers are apt to throw their hands up in frustration. Persist and ye shall be rewarded, I say. Let us apply these RSS equations to the two responses of the one-way clutch.
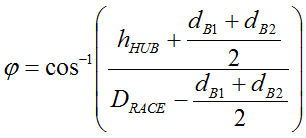
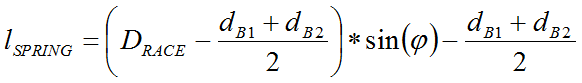
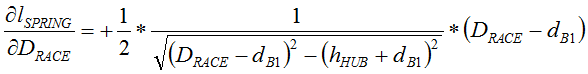
Here are the original non-linear transfer functions for stop angle and spring gap from the one-way clutch:
Up front, we recognize that, in the closed-form solution approach of RSS, the variation contributions of both bearing diameters (all being bought from the same supplier) will be equal. For simplification purposes in reducing the number of inputs (independent variables), we will assume them to be one and the same variable. (This will not be the case in Monte Carlo analysis.) After this simplification and some nasty first derivative handiwork, we end up with the following equations:
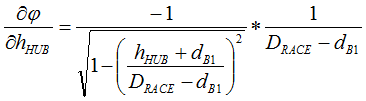
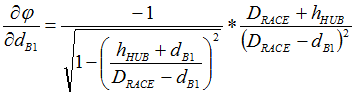
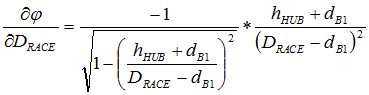
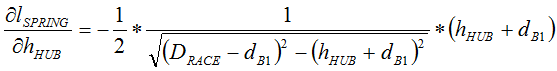
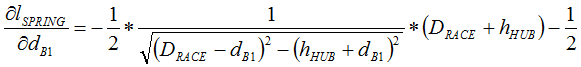
Have your eyes sufficiently glazed over? Those were only the first derivatives of this three-inputs-to-two-outputs system. I spare you the sight of the second derivatives. (They will be available within the Excel file attached to my next post.)
The WCA approach used the desired nominal values to center the input extreme ranges so it makes sense to use the desired nominals as input means. But what about the input standard deviations also required to complete RSS calculations? Assuming there is no data to define the appropriate variation, we resort to the tried-and-true assumption that your suppliers must be at least 3-sigma capable. Thus, one side of the tolerance would represent three standard deviations. Three on both side of the mean capture 99.73% of the cumulative possibilities. We assume the standard deviation is equal to one-third of the tolerance on either side of the mean.
In my next post, I finish the RSS application to the one-way clutch and compare them to WCA results. Please stay tuned!
Creveling, Clyde M., Tolerance Design: A Handbook for Developing Optimal Specifications (1997); Addison Wesley Longman, pp. 126-147.
Hahn, G.J. and Shapiro S.S. (1994), Statistical Models in Engineering; J Wiley and Sons, pp. 252-255.
Sleeper, Andrew D., Design for Six Sigma Statistics (2006); McGraw-Hill, pp. 716-730.